How it works
Click a number. See the graph behind it.
Every analysis page starts as a table, and each count in it is a question. Click one and the answer opens above the table as a graph, with the identity held in focus beside it while you switch views.
Identity Inventory
The column you click is the question you ask.
Most tools give you a table or a graph. In GraphnAI, six columns in the inventory each open a different graph for the same row.
- Reach (in)
- Who can reach this identity? Every path in, hop by hop.
- Reach (out)
- What can this identity reach? Its blast radius.
- Permissions (in)
- Who holds rights over it?
- Permissions (out)
- What rights does it hold?
- Membership
- What is it a member of? Nested groups included.
- Members
- Who is in this group?
Graphs grow a hop at a time, and any cluster holding a Tier 0 identity gets a red ring. Tap a cluster to narrow the table to its identities, then click one to re-centre the graph on it. A breadcrumb trail takes you back.
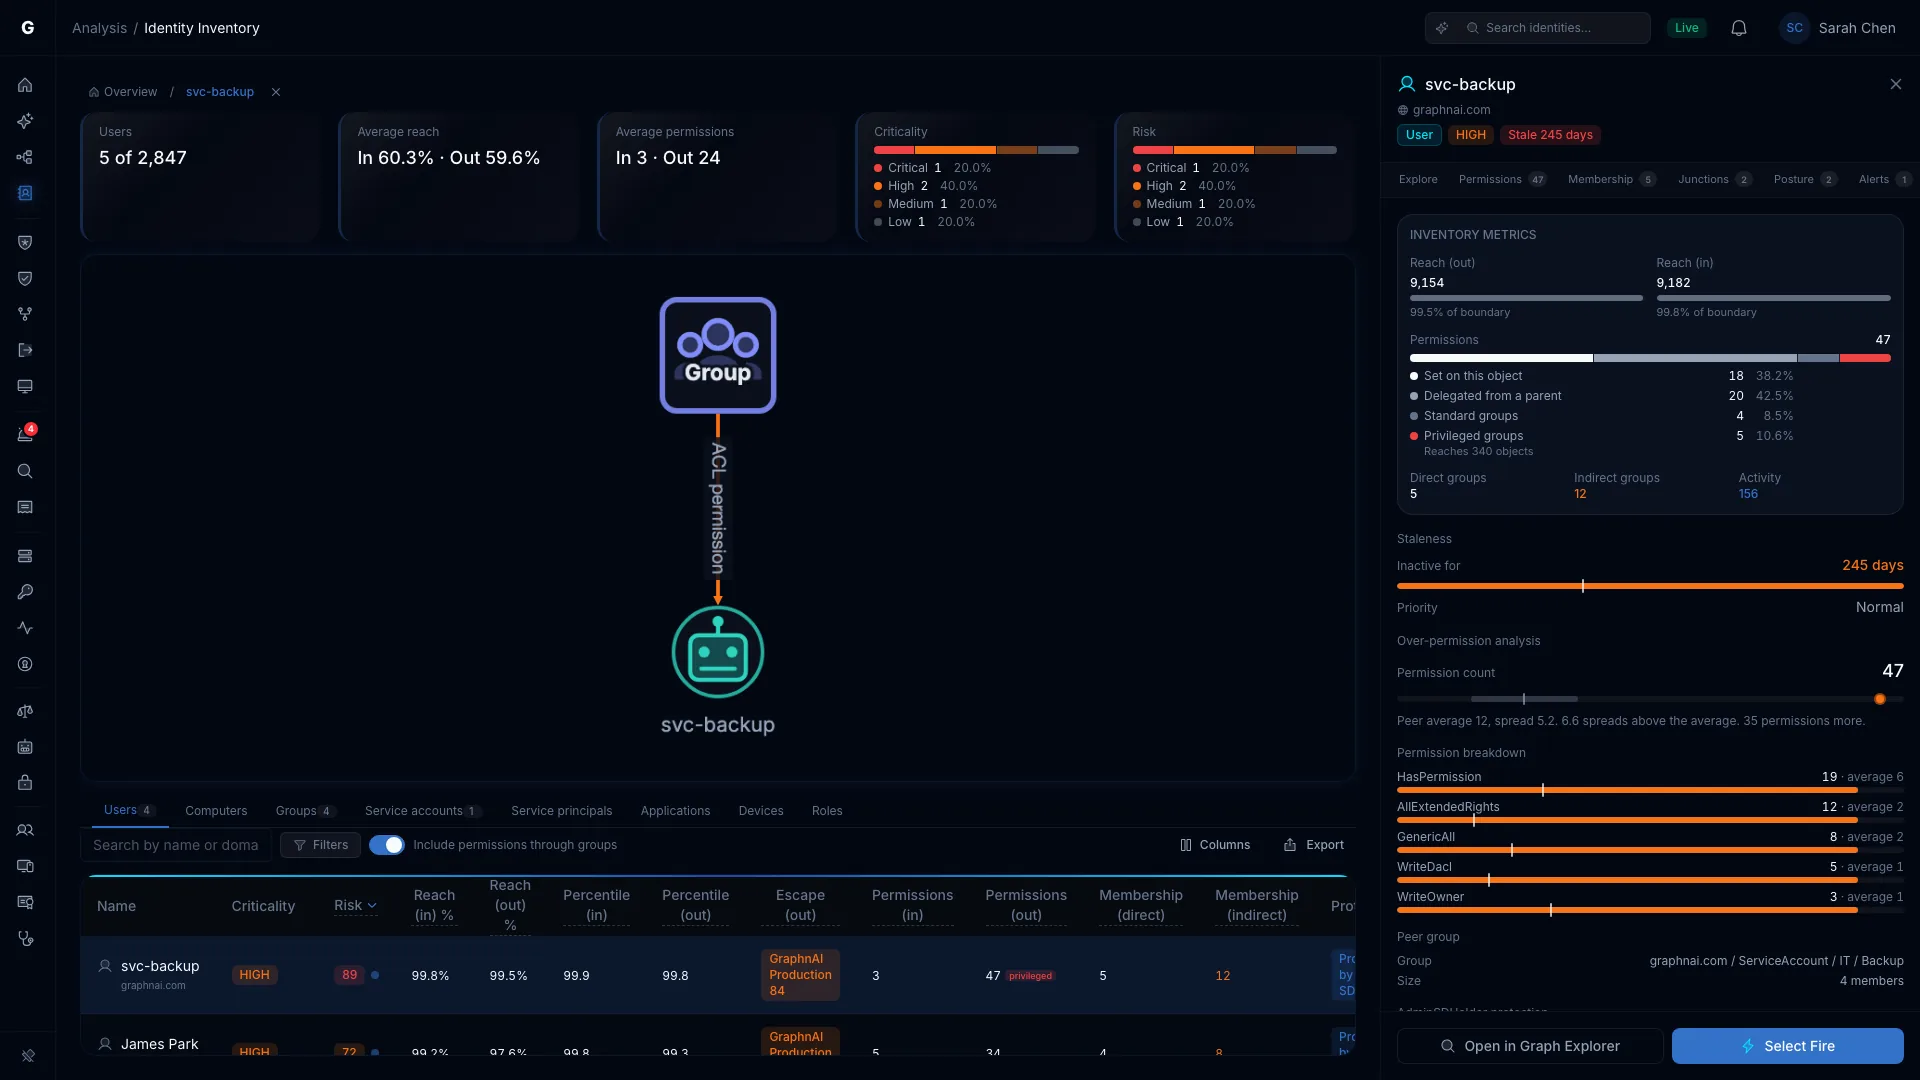
The identity flyout
One identity, seven points of view.
Most tabs in the identity flyout open the page that answers that question, already focused on the same identity. Only the graph and the evidence change.
- ExploreThe identity in the full graph.
- PermissionsIts permissions, compared with its peers.
- MembershipIts groups, direct and nested.
- JunctionsWhether attack paths funnel through it.
- PostureThe checks it fails, with the fixes.
- AlertsDetections that involve it.
- TimelineWhat it has done, without leaving the page.
Click a relationship in a graph, or in the table under it, and the flyout shows just that one, with its type, fidelity tier and whether it's dormant. From there you can revoke it through Select Fire, scoped to that pair.
Risk dashboard
Findings open where you found them.
Click a top finding and the dashboard reshapes around it, with a graph that fits the finding:
- Over-permissioned: the permission graph.
- Stale or Tier 0: everything the identity can reach.
- Critical junction: who can reach it, the shortest path through it to the target, and what the target reaches.
Close it and you're back where you were.
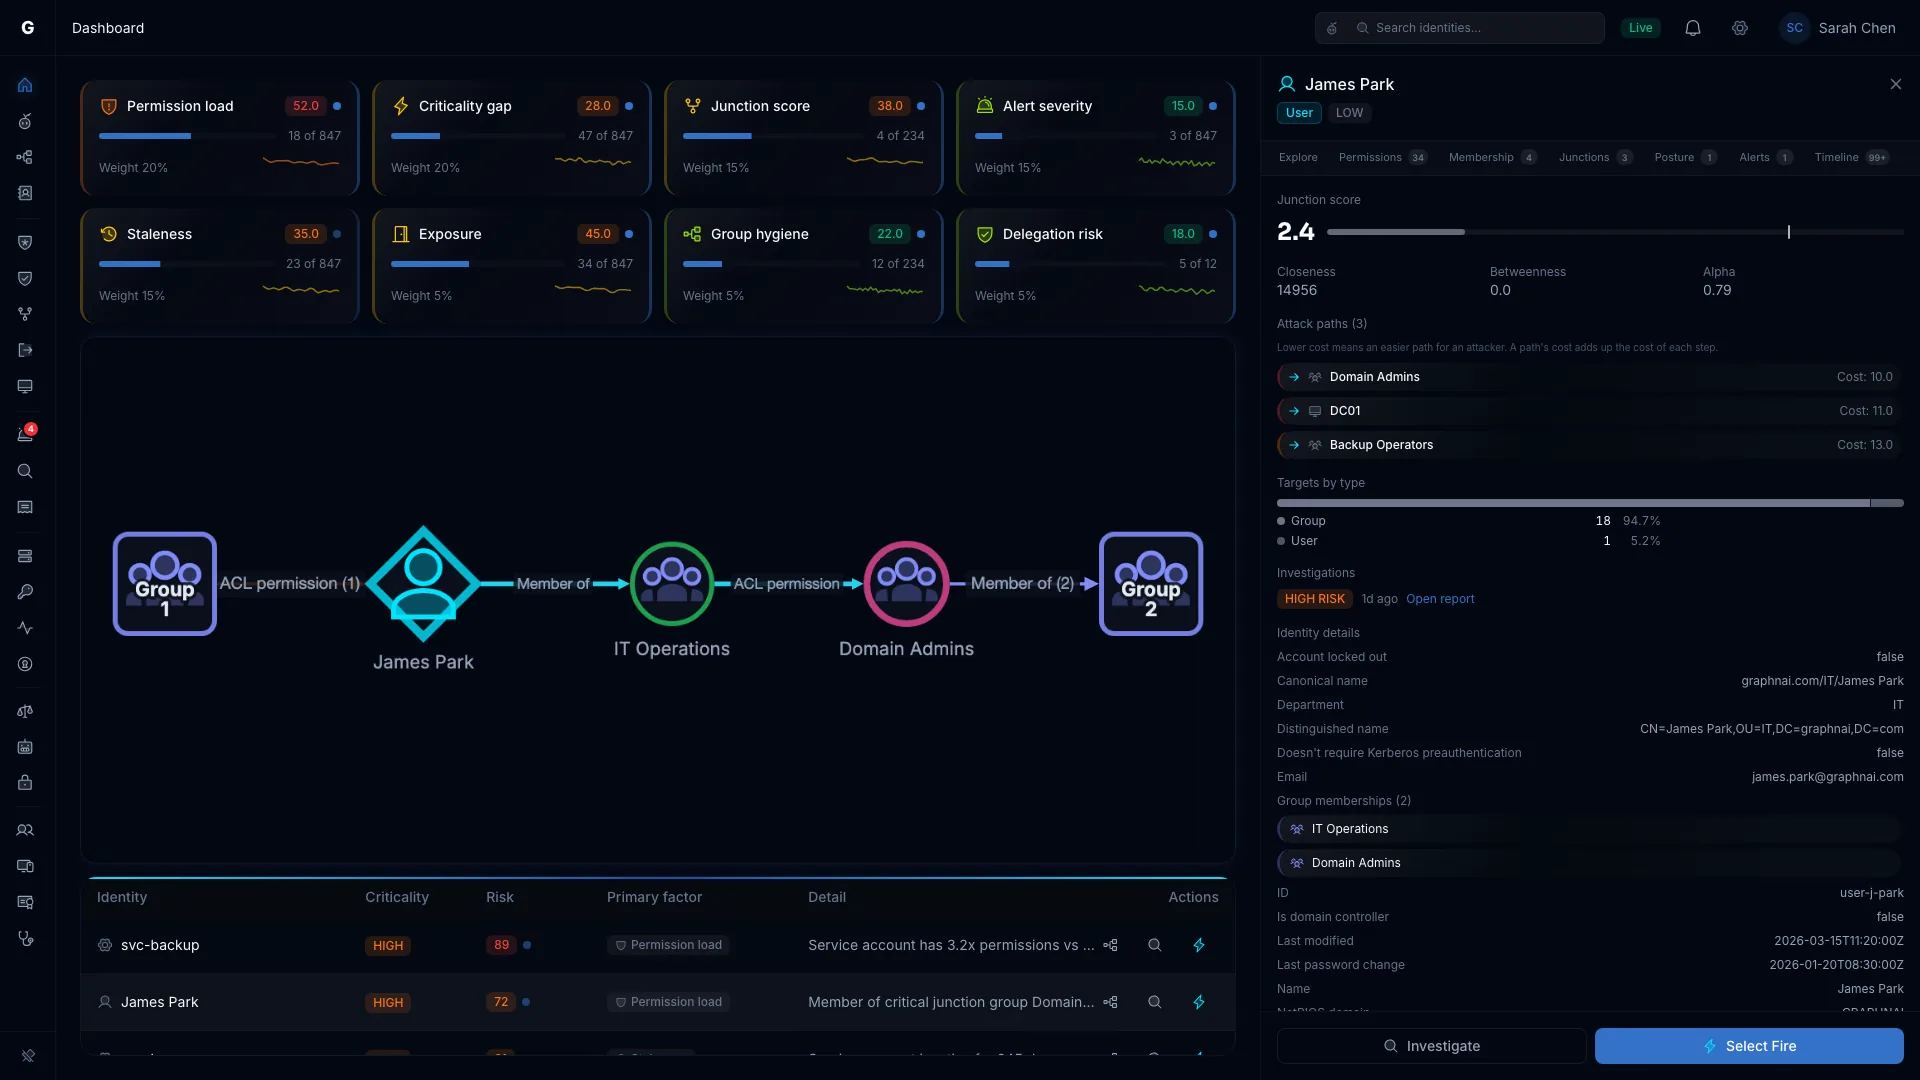
The same pattern everywhere
Security Posture and the Identity Timeline work the same way.
From a failing check to everything it exposes.
Click a failing check and the affected identity's blast radius opens above the table. Beside it you get the fix, the ATT&CK, D3FEND and ANSSI references, and the check's history.
- Found
- Last confirmed
- Fixed
- Confirmed as fixed
The event list and the graph drive each other.
Click a sign-in session and the graph becomes that session, with a scrubber to play it back. Click a host and the list narrows to what happened there. Entries outside the identity's usual hours or hosts are tinted.
The identity timelineWhat it does
Four jobs, one graph.
- See what's realFidelity tiers, the risk dashboard, Critical Junctions and security posture checks.
- Fix it safelySelect Fire simulates the fix, lets you choose how much to automate, and can undo it.
- Catch attacksIdentity threat detections, triage, the identity timeline and investigations.
- GraphneAsk in plain language. It answers with the query and evidence behind it.
Click your own numbers.
The Public Preview is free for 30 days from your first sync, on your own server.